The RIGHT Key Performance Indicators…
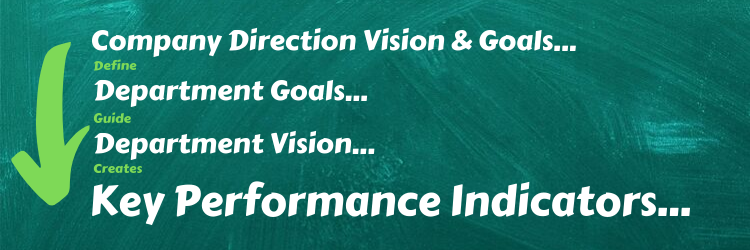
The right behavioral sales Key Performance Indicators along with a forward looking vision statement and clearly defined departmental goals are the bedrock on which great sales teams are built. Not incorporating all of these things or defining them in the wrong order will ultimately lead to a drop in performance.
Identifying the right Key Performance Indicators
A hypothetical Situation…
You’ve just taken over a new Sales department. Your new department handles multiple touch sales for high ticket items. The department’s performance is “ok” but there has been a recent trend in poor customer experience issues that need to be corrected.
Your Challenge: Determine what Key Performance Indicators you will use to monitor and repair the customer experience while performing at a high level.
The first step in creating the right Key Performance Indicators is understanding what you know, and identifying what you need to learn.
- I know that we are a multiple touch sales team with an elongated sales cycle and that there is something wrong with the customer experience.
- I need to learn what part of the customer journey (sales cycle) is “broken” or requires course correction.
Key Performance Indicators are specific.
As a Sales Manager taking over a new department we need to pinpoint exactly what is “broken” so we can measure the right KPI’s. We need to determine if we need to rebuild from the ground up or make adjustments somewhere in the sales cycle. In order to do this we need to look at three things.
- The client – Listen to client feedback and review all NPS or customer satisfaction survey results. Pay close attention to the comments and start collecting some keywords (word clouds) of frequently mentioned pain points. (Don’t have this information? Create a process for collecting it or start picking up the phone yourself.) . Along with looking at reviews ‘after the fact’, meaning after the sales process is complete, you should also be reviewing interactions between your team and the client that occurred during the sales process. Find out how you’re communicating, whats the tone like in the message, are there clear next steps, and if you’re using targeted and specific value adds based on client need.
- Your People – What are the struggles that your people encounter? Are they overloaded? Do they have enough insights into the leads or accounts they are working? Present any key data points you got from step one and collect their feed back. Most importantly, sit with them. Join them in going through their day, re-familiarize yourself with the day to day grind they encounter. Find ways to make them happy. Happy people, happy clients.
- The Data – Sit back with all the information you have collected and validate it against the data you have. If the client and your people both mention something that aligns with a specific step in the sales cycle, thats your starting point for investigation. Personally I love Tableau for everything data, it’s excel on steroids and you can make complicated data easy to communicate and easy for the receiver to digest.
Data drives Key Performance Indicators
Let’s look back on the hypothetical situation. There’s a problem with customer experience so we’re investigating the customer journey. We’ve talked to our people, clients and reviewed the data. We’ve identified the following consistencies in responses.
- The Client – The majority of client complaints come from a lack of follow up from the team or a lack of sales exec availability.
- Your People – 75% of your people report being overloaded with work and unable to handle all the leads and accounts they are assigned.
- The Data – The data shows a significant amount of time between each client interaction as well as heavy usage of short poorly formed email messages.
Note: Is it really this simple? Is it this easy to dig through thousands of interactions, client reviews and employee one on ones? No, but for the sake of this blog post I’m going over the basics to cover the thought process we as sale leaders undertake.
We just identified a common external theme with supporting internal feedback. We’ve also uncovered an opportunity, and as we all know, in sales opportunities are king. If we can alleviate the client concern (response time etc.), then we more than likely have made positive improvements in the amount of leads and accounts your people can manage. If we figure out how to increase employee bandwidth, we will increase employee output. The big question is “How?”. The answer, “Key Performance Indicators”.
Example Key Performance Indicators
One quick note: Key Performance Indicators are worthless unless they are measured, monitored and managed. If you don’t have the right tools to do this then you’re at a significant disadvantage. I’ve had the pleasure to work within SalesForce CRM (Lightning) and also spend some time working with the GearsCRM Salesforce Consulting team and I highly recommend utilizing salesforce to optimize your end to end sales cycle.
Note: Reiterating one more time for those that didn’t read the prior note: Fixing the customer journey is a significant task and requires more research and reflection than one short blog post can manage. The intention here is to form a few quick idea’s for unique Key Performance Indicators that may help move the needle. It is fully expected that any idea regarding Key Performance Indicators be thoroughly vetted before implementation.
% of Leads or Accounts with a specific and documented follow up date.
If we want to improve the follow up time, we need to make sure executives are scheduling a follow up date on every lead/account.
Number of Days Between Scheduled Follow Ups
Follow up time and response to request time should be measured in different KPI’s as to identify the root cause.
Number of Days Between Response
See ‘Number of Days BetweenScheduled Follow Ups’
% of Leads with a ‘Past Due’ Scheduled Follow Up
Now that we’re tracking follow up dates we need to be aware of any leads or accounts that are out of compliance.
Number of Engagement Attempts Per Lead
If all leads and accounts have a scheduled follow up and are within compliance, yet customer experience is sill suffering, we need to be able to examine the total number of engagement attempts (and reason) that we’re making.
Number of Engagement Attempts Per Sales Stage
Some sales stages require more heavy lifting in terms of communicating than others. we need to examine this on a granular (sales stage) level.
Key Performance Indicators
These are just a few quick idea’s for Key Performance Indicators based on a simple, yet common, situation. Can we add more KPI’s? Absolutely. Thats the beauty of it. Key Performance Indicators allow both sales managers and sales executives to be creative, fluid and effective.
Future Related Posts:
- Aligning Key Performance Indicators with Company vision and direction. [Coming Soon]
- Targeted specific value adds and how to uncover them. [Coming Soon]
- Happy People, Happy Clients and The Company ‘Triangle” [Coming Soon]
- Opportunities are King [Coming Soon]
- Alleviating Employee Bandwidth Issues [Coming Soon]
- Managing with Salesforce Lightning [Coming Soon]
- Tableau Data Visualization: A real life example [Coming Soon]
- Vetting Key Performance Indicators [Coming Soon]